Chapter 5 Mood
Mood is a common outcome in EMA research (Desmet, Vastenburg, & Romero, 2016; Myin-Germeys, Klippel, Steinhart, & Reininghaus, 2016). Having respondents rate their mood during the day allows researchers to assess mood fluctuation over time or reactivity to events and daily-stressors (Wenze & Miller, 2010). Often, it is studied in relation to depressive symptoms and mood disorders (Aan het Rot et al., 2012). In addition, mood can be linked to other variables, such as substance abuse (Kirchner & Shiffman, 2013; Serre, Fatseas, Swendsen, & Auriacombe, 2015), somatic health (Engel et al., 2016; Moore et al., 2016) or activity patterns (Dunton, 2017; Marszalek et al., 2014).
The definition of mood varies across studies. Usually the concept refers to a general affective state. Following this line of reasoning, a distinction can be made between mood states (e.g. irritable, cheerful, relaxed, etc.) and discrete emotions (e.g. happy, sad, anxious, etc.), where moods are thought to be less specific and more subjective, enduring and related to context (Beedie, Terry, & Lane, 2005; Cranford et al., 2006; Desmet et al., 2016).
Depending on the study focus and research questions, mood measurement can be operationalized in several ways. Therefore, it is vital to consider the goal of measuring mood in your own study and to choose an operationalization that matches your hypothesis and theoretical framework. In this chapter, we will discuss the most commonly used options: 1) unidimensional mood assessment, 2) the ‘bag of items’ approach, and 3) dimensional models, namely the Circumplex model and Negative and Positive affect (NA/PA).
5.1 Unidimensional Mood Assessment
Perhaps the most seemingly straight-forward method to measure mood is to ask ‘face-valid’ unidimensional questions such as “How is your mood right now” (Van Ballegooijen et al., 2016) or “How are you feeling right now” (Van de Ven et al., 2017). Respondents usually rate these questions on a Visual Analogue Scale (VAS), aimed to indicate mood intensity. Typically, VAS scales will range from zero (low or worst mood) to 10 or 100 (good or best mood). Keep in mind that the middle of a VAS scale (e.g. 5 or 50) is generally considered a negative result, and only scores above 6 or 60 are considered acceptable or positive mood states (Groot, 2010). In order to address this issue, some researchers have proposed to use VAS-scales ranging from -1 to 1, with 0 as a neutral center. However, such a scale implies a mood state that ranges from negative to positive, rather than absent to present. Another alternative is to use Likert scales, where the scale center often reflects a neutral response.
Plotting data from a unidimensional item in a graph is an easy way to visually inspect within-subject change in general mood:
# Plotting data over time.
library(ggplot2)
library(emaph)

plotmood_down <- ggplot(csd, aes(x = date, y = as.numeric(mood_down))) +
  geom_smooth(method = "loess", span = .05, se = FALSE, colour="dodgerblue4") +
  geom_point(size = .3, alpha = .3, position = position_jitter(height = .1),
  colour="dodgerblue2") +  scale_x_date() + scale_y_continuous(breaks = 1:7) +
  xlab("Time") + ylab("Mood")
print(plotmood_down)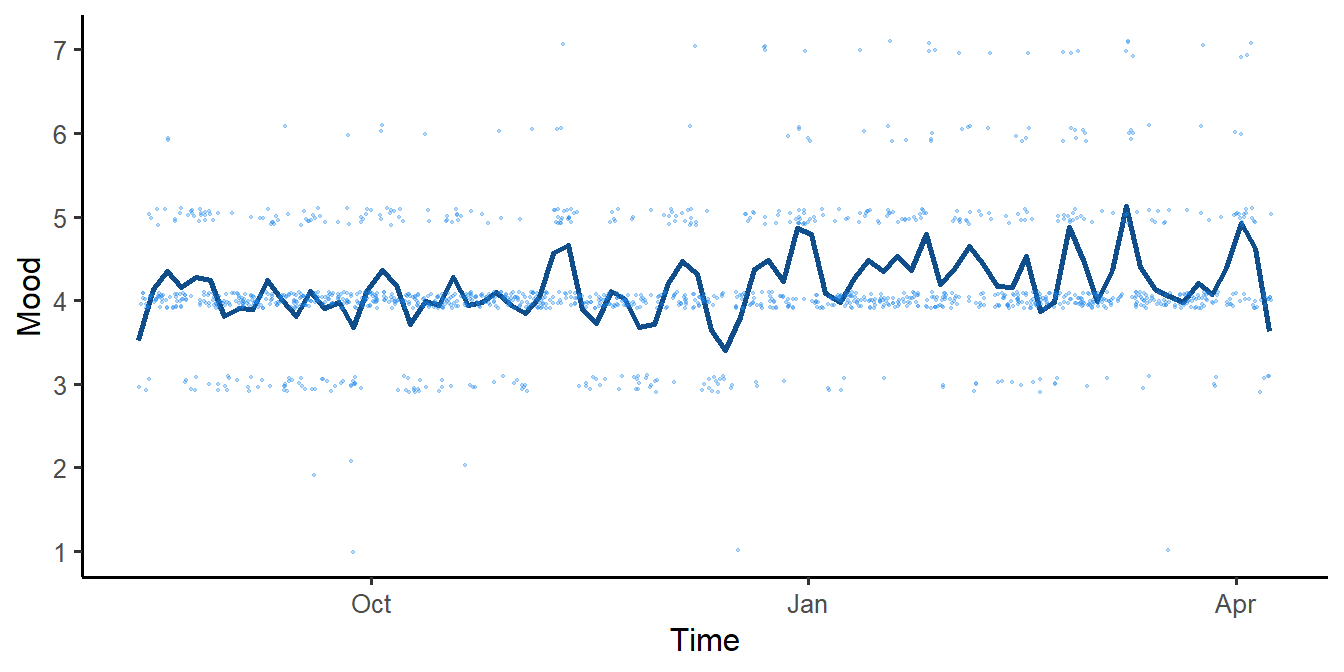
Figure 5.1: 34 weeks of mood data, from a single participant
5.1.1 Bipolar Unidimensional Items
Another option to assist respondents with the interpretation of one-item mood ratings, is to use a bipolar scale. These items place two opposing mood states at each end of the scale, for example by asking “Please rate your current mood on a scale of 0 to 100, on which 0 indicates happy, and 100 indicates sad” (Van Rijsbergen et al., 2014). This does assume that the opposing mood states, such as happy and sad, are mutually exclusive and thus cannot occur simultaneously. The bipolar-unidimensional method was shown to be able to predict time to relapse over 5.5 years in recurrently depressed out-patients, with 6.3% of variance in time to relapse explained. This percentage was comparable to that of the HAM-D (Van Rijsbergen et al., 2012). Also, the scale was able to detect relapse in patients with recurrent Major Depressive Disorder (based on SCID-I interview) at a cut-off score of 55, and outperformed the HAM-D and IDS-SR. However, 47% of patients indicated by the VAS scale did not fulfill formal criteria for relapse (false positives) (Van Rijsbergen et al., 2014).
5.2 Bag-of-Items
In order to make sure all constructs of interest are measured, you can also consider including a number of specific mood items in your EMA questionnaire, rather than one general unipolar item or one bipolar item. For example, you can ask respondents “How depressed are you feeling right now?” and “How anxious are you feeling right now?” (Starr & Davila, 2012). This strategy often leads to a ‘bag-of-items’ approach, where single items from various sources, such as existing questionnaires, are combined into a new EMA questionnaire. A benefit of this approach is that you can select items for which information on validity and test-retest reliability is available. A downside is that item scores can only be evaluated separately, rather that providing one overall indication of mood or well-being.
Combining data from multiple items, such as mood and loneliness, in one graph can provide respondents with insight in the interaction between the constructs. In R two variables can easily be plotted together:
# Plotting multiple variables in one graph.
library(ggplot2)
library(emaph)

combined <- plotmood_down +
  geom_point(data=csd, aes(date,as.numeric(mood_lonely)),
    size = .3, alpha = .3, position = position_jitter(height = .1),
    colour="indianred4") +
  geom_smooth(data=csd, aes(date,as.numeric(mood_lonely)),
    method = "loess", span = .05, se = FALSE, colour="indianred2")
print(combined)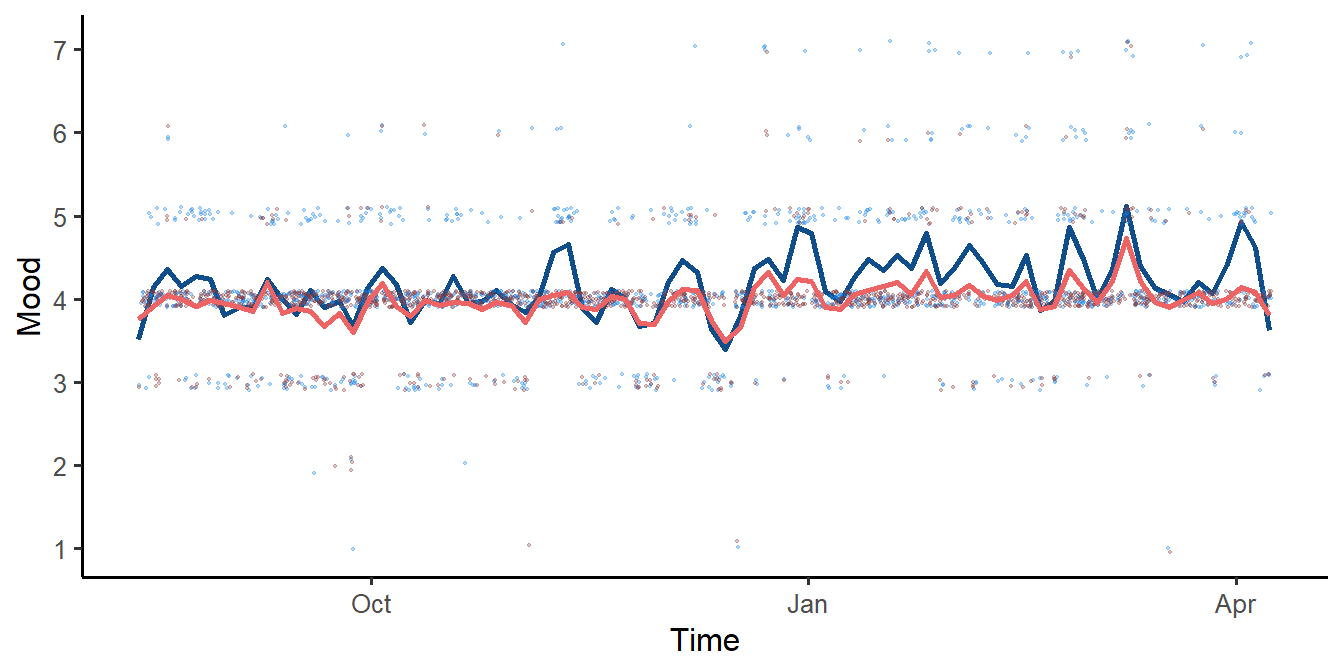
Figure 5.2: 34 weeks of combined mood data, from a single participant
5.3 Multi-dimensional Mood Assessment
Dimensional models assume that every affective state or emotion should be described by the combined score on (at least) two items, instead of just one. Over the past decades several multi-dimensional models have been specified (for an overview, see D. Sander & Scherer (2009)). In the context of EMA, researchers most often base their items on the Circumplex model (Russell, 1980) or the Negative/Positive affect (NA/PA) theory (Watson & Tellegen, 1985).
5.3.1 The Circumplex Model
The Circumplex Model of affect (Posner, Russell, & Peterson, 2005; Russell, 1980) argues that all mood states are a linear combination of two independent, bipolar scales: valence (ranging from unpleasant to pleasant) and arousal/activation (ranging from low to high arousal). Combining scores on these scales places the affective states in a circle on one of four quadrants (see Figure 5.3). States within one quadrant are believed to be positively correlated, while states in the opposing quadrant are thought to be negatively correlated.
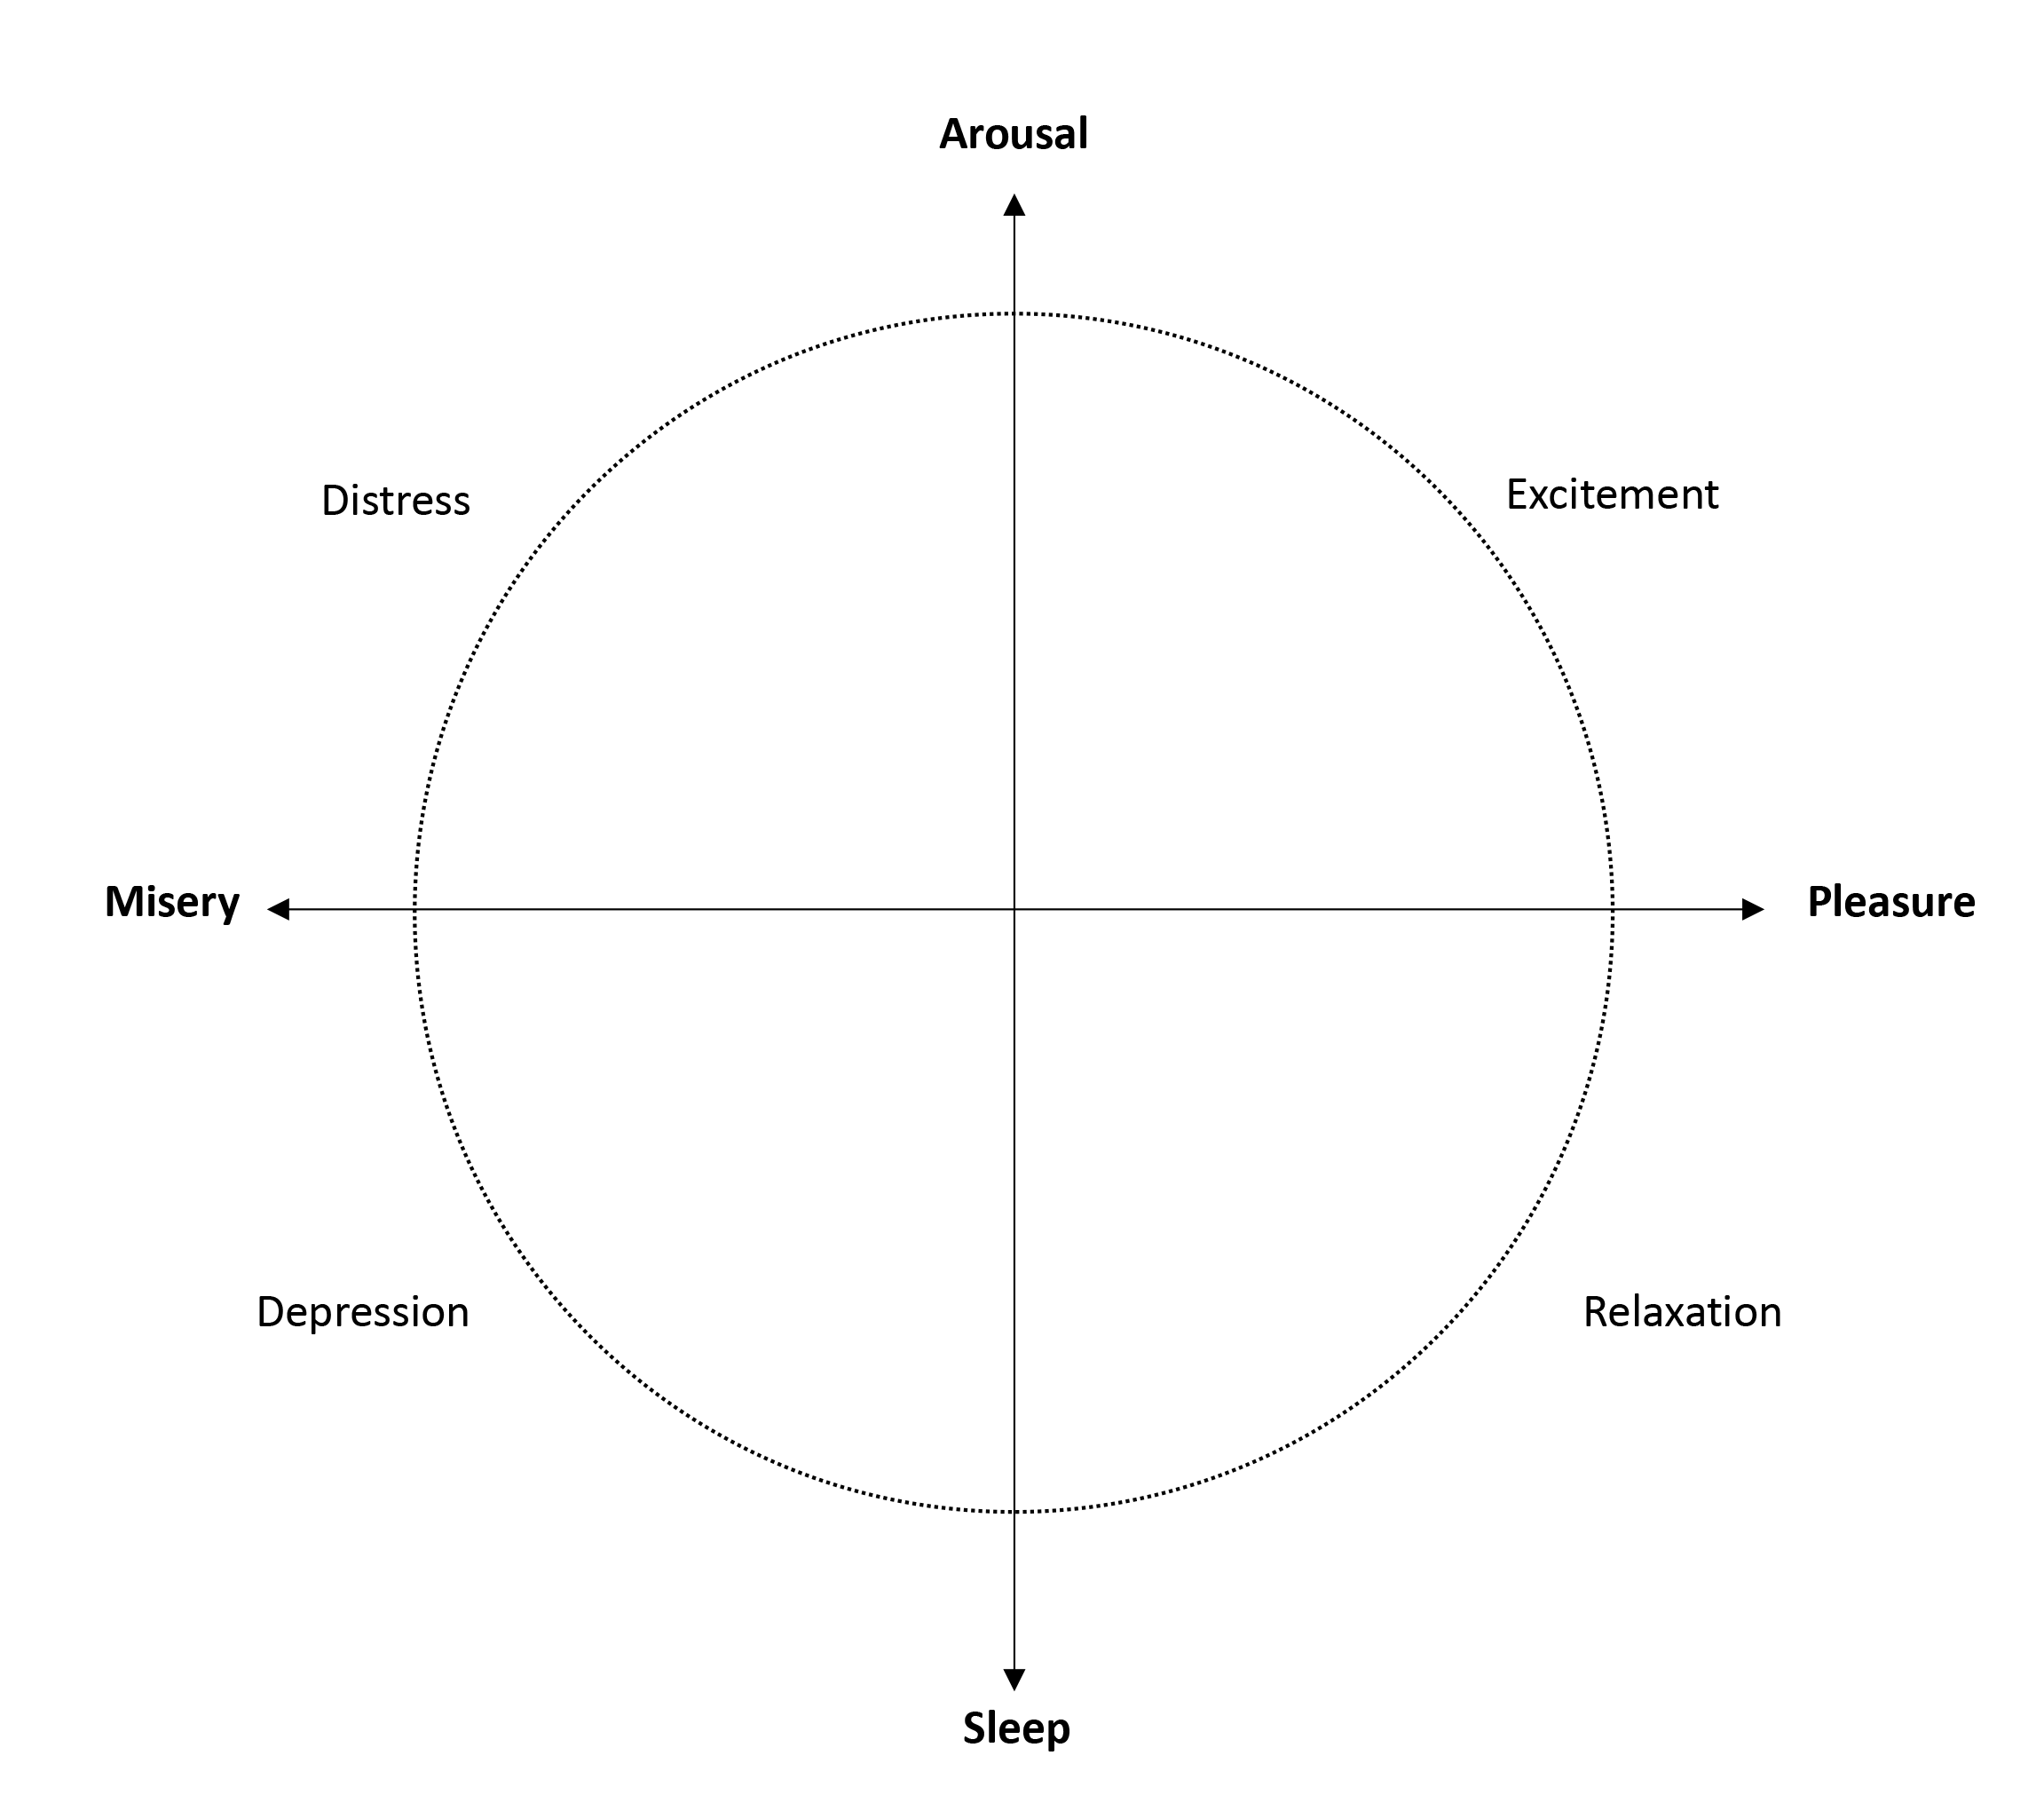
Figure 5.3: Russell’s Circumplex model of affect.
There are several options to operationalize the Circumplex model in EMA research. For example, respondents can rate valence and arousal on two VAS scales. The most pragmatic approach is to report both scale scores separately (Asselbergs et al., 2016). Alternatively, scores can be combined to give insight into which of the four mood states (quadrants) respondents fall:
- Low aroused - unpleasant
- Low aroused - pleasant
- High aroused - unpleasant
- High aroused - pleasant
A downside of the Circumplex model is that the concepts of valence and arousal can be hard to convey to respondents, especially when translated to other languages, such as Dutch. One alternative is to adjust the scale ends, for example using “extreme sleepiness” and “extreme high energy” (Sharar et al., 2016). Another option is to use pictures or emoticons, rather than language. For this purpose, DeSmet and colleagues developed the pick-a-mood scale, which is a pictorial self-report scale (Desmet et al., 2016). The scale builds on the circumplex model and adds the third dimension “dominance” (level of experienced control over the mood state), rendering eight (instead of four) different mood states and one neutral state (see Figure 5.4).
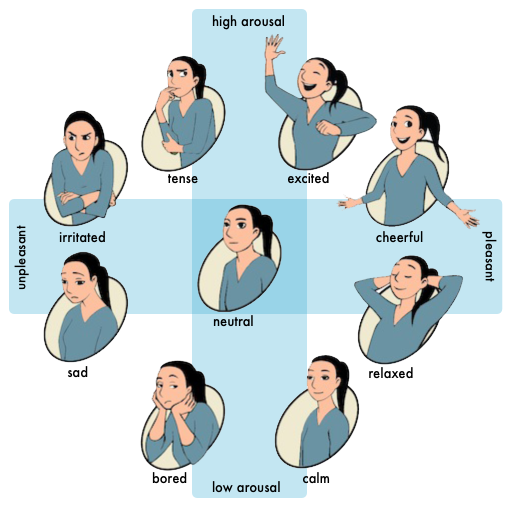
Figure 5.4: The Pick-A-Mood Circle.
5.3.2 Negative & Positive Affect
Watson and Tellegen (Watson & Tellegen, 1985) also specified the underlying theory of the Circumplex model, arguing that the diagonal quadrants represent Positive and Negative affect (PA/NA) and that these two terms are the main dimensions of affect (Watson & Clark, 1994). PA ranges from sadness to high energy, NA from calmness to distress (Watson, Clark, & Tellegen, 1988). While bipolar-unidimensional assessment assumes that positive and negative affect are mutually exclusive, the PA/NA affect model assumes that these mood states can occur simultaneously. Watson and Clark (Watson & Clark, 1997) for example, showed a moderate correlation between the two constructs (r = .32). In order to measure Positive and Negative Affect, a designated Positive and Negative Affect Schedule was developed by Watson, Clark and Tellegen (Watson et al., 1988). Respondents are asked to indicate “to what extent you feel this way right now” on 20 affect items. The scale uses a 5-point Likert-scale, ranging from 1 (very slightly or not at all) to 5 (very) (Watson & Clark, 1994). Items include:
- Negative Affect (10): afraid, scared, nervous, jittery, irritable, hostile, guilty, ashamed, upset, distressed
- Positive Affect (10): active, alert, attentive, determined, enthusiastic, excited, inspired, interested, proud, strong
There are several short-forms available. For example, Wichers and colleagues created a 10-item short-form of the PANAS for their EMA studies. The items were based on the PANAS and their own experience with EMA (Wichers et al., 2012). Using factor analyses, the following 7-point Likert items were chosen for the questionnaire:
- Negative affect (6): insecure, lonely, anxious, low, guilty, suspicious.
- Positive affect (4): cheerful, content, energetic, enthusiastic.
PA and NA were calculated as the average score across all items and weighted for their factor loadings (Wichers et al., 2012). Figure 5.5 shows the PA/NA factors in the data set of the ‘Critical Slowing Down’-study [Van de Leemput et al. (2014); see also Chapter 9].
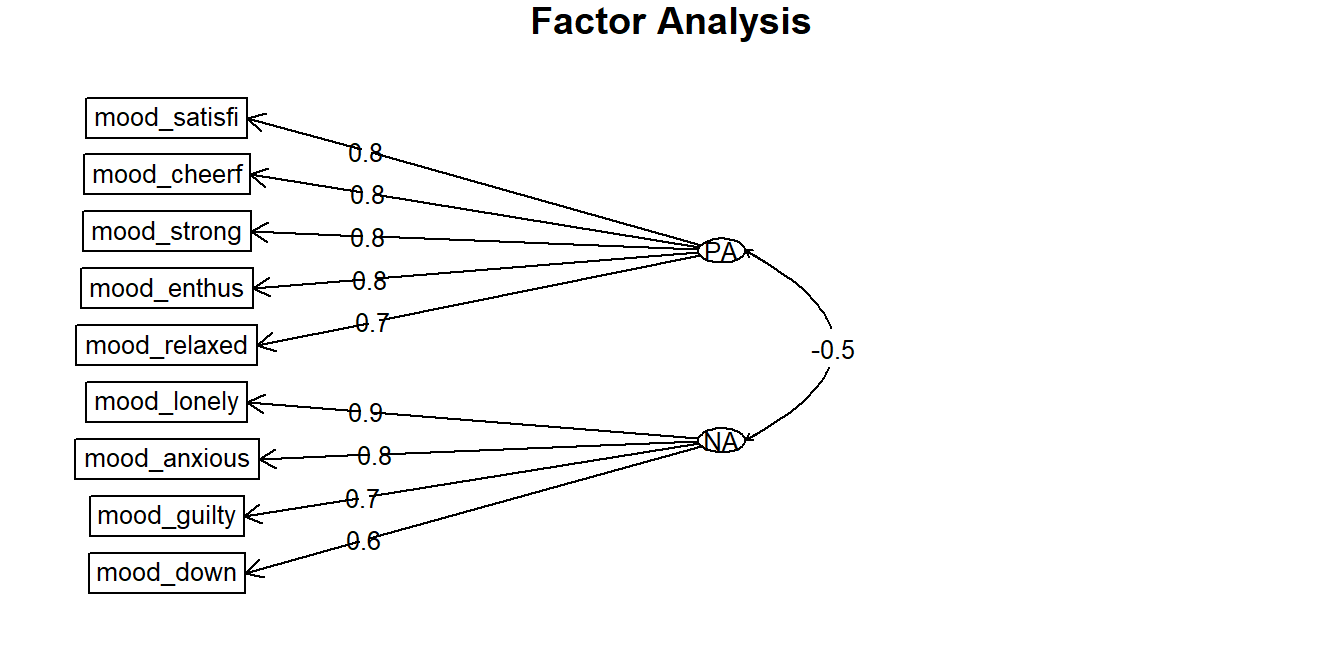
Figure 5.5: Factor analysis of scores of 9 EMA items, revealing two factors: Positive Affect (PA) and Negative Affect (NA).
References
Desmet, P. M. A., Vastenburg, M. H., & Romero, N. (2016). Mood measurement with Pick-A-Mood: Review of current methods and design of a pictorial self-report scale. Journal of Design Research, 14(3), 241–279. https://doi.org/10.13140/RG.2.1.3894.9365
Myin-Germeys, I., Klippel, A., Steinhart, H., & Reininghaus, U. (2016). Ecological momentary interventions in psychiatry. Current Opinion in Psychiatry, 29(4), 258–263. https://doi.org/10.1097/YCO.0000000000000255
Wenze, S. J., & Miller, I. W. (2010). Use of ecological momentary assessment in mood disorders research. Clinical Psychology Review, 30(6), 794–804. https://doi.org/10.1016/j.cpr.2010.06.007
Aan het Rot, M., Hogenelst, K., & Schoevers, R. A. (2012). Mood disorders in everyday life: A systematic review of experience sampling and ecological momentary assessment studies. Clinical Psychology Review, 32(6), 510–523. https://doi.org/10.1016/j.cpr.2012.05.007
Kirchner, T. R., & Shiffman, S. (2013). Ecological Momentary Assessment. In The wiley-blackwell handbook of addiction psychopharmacology (pp. 541–565). Wiley-Blackwell. https://doi.org/10.1002/9781118384404.ch20
Serre, F., Fatseas, M., Swendsen, J., & Auriacombe, M. (2015). Ecological momentary assessment in the investigation of craving and substance use in daily life: A systematic review. https://doi.org/10.1016/j.drugalcdep.2014.12.024
Engel, S. G., Crosby, R. D., Thomas, G., Bond, D., Lavender, J. M., Mason, T., … Wonderlich, S. A. (2016). Ecological momentary assessment in eating disorder and obesity research: A review of the recent literature. https://doi.org/10.1007/s11920-016-0672-7
Moore, R. C., Depp, C. A., Wetherell, J. L., & Lenze, E. J. (2016). Ecological momentary assessment versus standard assessment instruments for measuring mindfulness, depressed mood, and anxiety among older adults. Journal of Psychiatric Research, 75, 116–123. https://doi.org/10.1016/j.jpsychires.2016.01.011
Dunton, G. F. (2017). Ecological momentary assessment in physical activity research. Exercise and Sport Sciences Reviews, 45(1), 48–54. https://doi.org/10.1249/JES.0000000000000092
Marszalek, J., Morgulec-Adamowicz, N., Rutkowska, I., Kosmol, A., Marszalek, J., Morgulec-Adamowicz, N., … Kosmol, A. (2014). Using ecological momentary assessment to evaluate current physical activity. BioMed Research International, 2014, e915172. https://doi.org/10.1155/2014/915172
Beedie, C., Terry, P., & Lane, A. (2005). Distinctions between emotion and mood. Cognition & Emotion, 19(6), 847–878. https://doi.org/10.1080/02699930541000057
Cranford, J. A., Shrout, P. E., Iida, M., Rafaeli, E., Yip, T., & Bolger, N. (2006). A procedure for evaluating sensitivity to within-person change: Can mood measures in diary studies detect change reliably? Personality and Social Psychology Bulletin, 32(7), 917–929. https://doi.org/10.1177/0146167206287721
Van Ballegooijen, W., Ruwaard, J., Karyotaki, E., Ebert, D. D., Smit, J. H., & Riper, H. (2016). Reactivity to smartphone-based ecological momentary assessment of depressive symptoms (MoodMonitor): Protocol of a randomised controlled trial. BMC Psychiatry, 16(1), 359. https://doi.org/10.1186/s12888-016-1065-5
Van de Ven, P., O’Brien, H., Henriques, R., Klein, M., Msetfi, R., Nelson, J., … Riper, H. (2017). ULTEMAT: A mobile framework for smart ecological momentary assessments and interventions. Internet Interventions, 9, 74–81. https://doi.org/10.1016/j.invent.2017.07.001
Groot, P. C. (2010). Patients can diagnose too: How continuous self-assessment aids diagnosis of, and recovery from, depression. Journal of Mental Health, 19(4), 352–362. https://doi.org/10.3109/09638237.2010.494188
Van Rijsbergen, G. D., Burger, H., Hollon, S. D., Elgersma, H. J., Kok, G. D., Dekker, J., … Bockting, C. L. (2014). How do you feel? Detection of recurrent Major Depressive Disorder using a single-item screening tool. Psychiatry Research, 220(1-2), 287–293. https://doi.org/10.1016/j.psychres.2014.06.052
Van Rijsbergen, G. D., Bockting, C. L. H., Berking, M., Koeter, M. W. J., & Schene, A. H. (2012). Can a one-item mood scale do the trick? Predicting relapse over 5-years in recurrent depression. Plos One, 7(10), 1–5. https://doi.org/10.1371/journal.pone.0046796
Starr, L. R., & Davila, J. (2012). Temporal patterns of anxious and depressed mood in generalized anxiety disorder: A daily diary study. Behaviour Research and Therapy. https://doi.org/10.1016/j.brat.2011.11.005
Sander, D., & Scherer, K. (2009). Oxford companion to emotion and the affective sciences. Oxford University Press.
Russell, J. A. (1980). A circumplex model of affect. Journal of Personality and Social Psychology, 39(6), 1161. https://doi.org/10.1037/h0077714
Watson, D., & Tellegen, A. (1985). Toward a consensual structure of mood. Psychological Bulletin, 98(2), 219. https://doi.org/10.1037/0033-2909.98.2.219
Posner, J., Russell, J. A., & Peterson, B. S. (2005). The circumplex model of affect: An integrative approach to affective neuroscience, cognitive development, and psychopathology. Development and Psychopathology, 17(3), 715–734. https://doi.org/http://dx.doi.org/10.1017/S0954579405050340
Asselbergs, J., Ruwaard, J., Ejdys, M., Schrader, N., Sijbrandij, M., & Riper, H. (2016). Mobile phone-based unobtrusive ecological momentary assessment of day-to-day mood: An explorative study. Journal of Medical Internet Research, 18(3), e72. https://doi.org/10.2196/jmir.5505
Sharar, S. R., Alamdari, A., Hoffer, C., Hoffman, H. G., Jensen, M. P., & Patterson, D. R. (2016). Circumplex model of affect: A measure of pleasure and arousal during virtual reality distraction analgesia. Games for Health Journal, 5(3), 197–202. https://doi.org/10.1089/g4h.2015.0046
Watson, D., & Clark, L. A. (1994). The PANAS-X : Manual for the Positive and Negative Affect Schedule - expanded Form. Iowa: University of Iowa. Retrieved from https://pdfs.semanticscholar.org/9e15/83dd26e0741e2bf74112405e97d948170128.pdf
Watson, D., Clark, L. A., & Tellegen, A. (1988). Development and validation of brief measures of Positive and Negative Affect : The PANAS scales. Journal of Personality and Social Psychology, 54(6), 1063–1070. https://doi.org/10.1037/0022-3514.54.6.1063
Watson, D., & Clark, L. A. (1997). Measurement and mismeasurement of mood: Recurrent and emergent issues. https://doi.org/10.1207/s15327752jpa6802_4
Wichers, M., Peeters, F., Rutten, B. P. F., Jacobs, N., Derom, C., Thiery, E., … Van Os, J. (2012). A time-lagged momentary assessment study on daily life physical activity and affect. Health Psychology, 31(2), 135–144. https://doi.org/10.1037/a0025688
Van de Leemput, I. A., Wichers, M., Cramer, A. O. J., Borsboom, D., Tuerlinckx, F., Kuppens, P., … Scheffer, M. (2014). Critical slowing down as early warning for the onset and termination of depression. Proceedings of the National Academy of Sciences, 111(1), 87–92. https://doi.org/10.1073/pnas.1312114110