Chapter 3 Study Design
As with all scientific research, EMA studies start with mindful consideration of the study design. Issues that need to be considered are the research question(s), the hypotheses, the population of interest, and the nature of the comparison groups (Shiffman et al., 2008).
Ample information on general study design issues can be found elsewhere (see for example, the APH quality handbook, at http://www.emgo.nl/kc/). This chapter highlights key design aspects of EMA studies.
3.1 What is the EMA Research Question?
Given the plethora of new research options that emerged from the rapid development in EMA technologies, it can be tempting to dive straight into exploratory data collection, without giving much consideration to the theoretical background of the study. That, however, would be one pitfall of EMA research to avoid. Data mining is no substitute for theory. Asking participants to contribute data without a rationale is unethical. As in all scientific activities, defining the research question should be the first step.
Ask yourself what EMA could bring to your topic of interest. How is it different from traditional assessment methods? What questions does it allow you to address that you could not answer without it? For this, you could use any of the EMA advantages discussed in Chapter 1. Are you interested in real-life behavior, in differences between participants, in changes within participants over time, or in potential causal pathways between health-related variables? What relationships do you expect to find, and why? A solid theoretical background, and clearly formulated explicit research questions and hypotheses will help to make the right choices when you have to decide on the other aspects of the study design.
3.2 Who are the Study Participants?
Given the experimental nature of EMA, studies are often piloted in healthy or sub-clinical populations. This is a recommended first step, to test the experimental procedures and to avoid unnecessary burdening of vulnerable patient populations. You should be aware, though, that results obtained in non-patient populations do not necessarily generalize to patient populations. EMA mood ratings, for example, might be much more variable in patients compared to non-patients. Pilot studies should therefore also be conducted in the target population. It is also advisable to write a manual on how to operate the EMA device and spend time on briefing participants on what is expected of them during the study. Depending on your study topic and EMA method, de-briefing might also be necesarry, along with instructions on how to return a wearable or de-install an EMA app.
3.3 What are the Qualities of the EMA Measures?
With the study hypotheses in place, theoretical constructs must be operationalized into quantitative measures. For this, you should consult the scientific literature on the reliability and validity of existing EMA measures (e.g., Moore et al., 2016; Van Rijsbergen, Bockting, Berking, Koeter, & Schene, 2012).
In active EMA research, complex multi-dimensional constructs such as mood and anxiety are often measured using single-item questions, to reduce the assessment burden of participants, who are prompted several times per day. You should ask yourself (and the scientific literature) what the psychometric properties are of these measures. How do these EMA-measures compare to scores on traditional assessments (e.g., self-report questionnaires, clinical interviews)? What is known about the variability of items scores? And what is known about the measurement errors? Surprisingly, these last questions are often ignored in EMA research, even though it has been estimated that up to 30% to 50% of the observed variance in intensive repeated measures data can be attributable to measurement error (Schuurman, Houtveen, & Hamaker, 2015).
In passive EMA research, it is important to be aware of the characteristics and limitations of the ‘data acquisition interfaces’ (Stone & Shiffman, 2002). For example, if you want to collect accelerometer data, a variety of options exist. You can collect these data via the built-in accelerometer of the smartphone of the participants, via cheap commercially available activity trackers, such as Fitbit, or via expensive wearable devices that are developed specifically for scientific research. Each option comes with specific advantages and disadvantages. Smartphone-based accelerometer data, for example, can be collected with relative ease, but these data can also be noisy and incomplete, since samples rates can often not be set and the precision of the built-in sensors varies considerably from device to device. Commercial accelerometers may have better precision and reliability (see, e.g., Evenson et al., 2015), but manufacturers often limit access to raw data and data pre-processing algorithms, making it difficult (or even impossible) to fully analyze outcomes. ‘Scientific wearables’ do offer this access, but often choose function over form (design). They can therefore draw attention, prompting unwanted questions to partcipants. Being aware of these issues when you plan the study, will help considerably in the analysis stage of your study.
3.4 What is the Sample Plan?
An important next step is to define the EMA data sample plan. Questions that need to be answered are:
- How many days will data collection last?
- On each day, how often are participants assessed?
- How and when are participants invited for assessment?
The questions above should be answered as detailed as possible to best serve the research question and the statistical power (see below). In practice, however, it is often necessary to balance research interests, respondent burden, and practical considerations, such as hardware limitations.
When determining the appropriate sample plan, start with mapping the expected fluctuation or patterns, based on available knowledge. For example, when an event is rare, it can be sufficient to ask participants to initiate EMA whenever the event occurs, or prompt them with an end-of-day diary. Adding more prompts in this scenario would not lead to more reliable data (Piasecki et al., 2007). Increasing the assessment frequency and study duration will allow for a more detailed assessment of the outcome of interest. It is tempting to collect often and for a long period of time. However, this may also increase respondent burden, which may, in turn, affect study adherence and accuracy. Measurement reactivity could also occur, where the EMA-induced enhanced focus on the outcome of interest causes participants to increase or decrease on this outcome (Hufford, Shields, Shiffman, Paty, & Balabanis, 2002; Van Ballegooijen et al., 2016).
Issues related to hardware should also be considered. Electronic wearables have limited battery life and memory storage space. Memory space limitations of actigraphy watches may require participants to visit the research site. GPS-monitoring apps may have a negative impact on the battery life of the smartphone of the participants. These practical issues may also result in data loss and study drop-out.
Once all decisions related to the sampling plan are made, the procedure should be thoroughly tested. As a first step, it can be insightful to simulate the sample plan, as is done below, using the sample_plan function, which is part of package emaph:
# Simulating a signal-contingent sample plan.
library(emaph)
plan <- sample_plan(n_participants = 5,
                    n_days = 2,
                    times = c("09:00-11:00", "12:30", "17:00-19:00"),
                    plot = TRUE)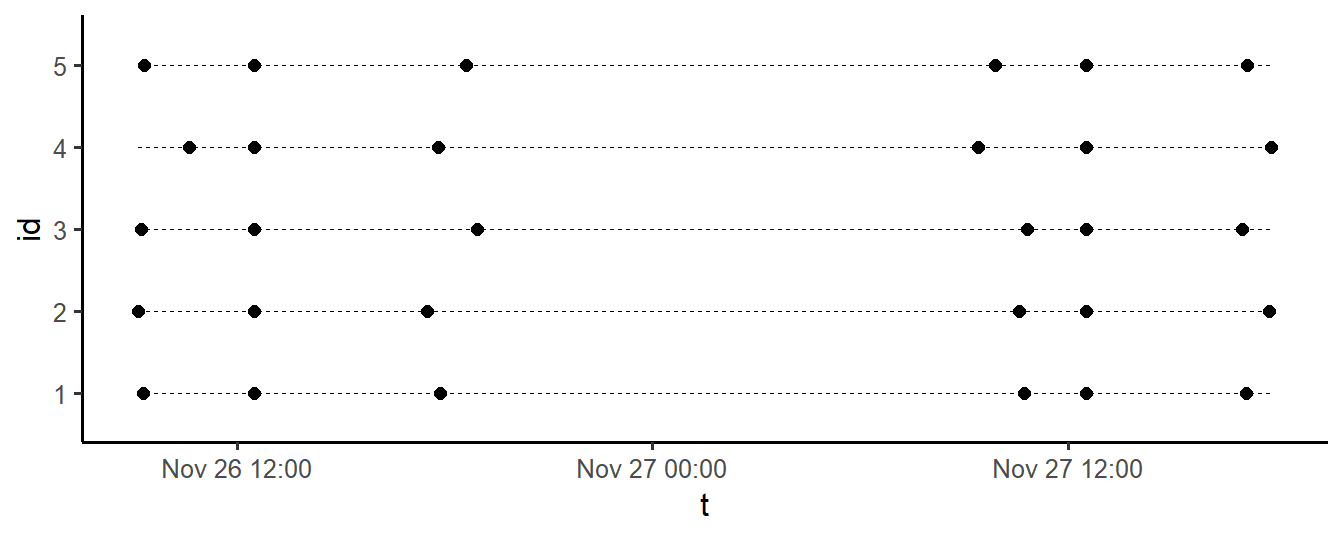
Figure 3.1: Generated two-day EMA sampling plan, for 5 participants
3.5 What is the Optimal Sample Size?
The power of a statistical test is the probability that it will detect an effect when this effect, in reality, exists. It is a function of the strength of the effect size, sample size, the significance level (alpha), and the statistical model. Determining the power of the experiment is an important step in the design of any study - EMA studies included. Both under-powered and overpowered studies are a waste of time and resources.
Conducting a power analysis can be easy or very difficult, depending on the complexity of the experimental design and the adopted statistical technique. For simple tests, such as the t-test and ANOVA, straightforward analytic solutions exist, which are implemented in readily available tools. In R, one of those tools is package pwr (which you can install, as you now know, via install.packages('pwr')).
For example, to use pwr to calculate the power of a t-test to detect a moderate effect size (d = 0.5), with n = 30 per group, and a (two-sided) significance level alpha of .05, type:
# Power analysis of a t-test
# (analytical approach).

library(pwr)
pwr.t.test(d = 0.5,
           n = 30,
           sig.level = 0.05,
           type = "two.sample",
           alternative = "two.sided")
#>
#>      Two-sample t test power calculation
#>
#>               n = 30
#>               d = 0.5
#>       sig.level = 0.05
#>           power = 0.4778965
#>     alternative = two.sided
#>
#> NOTE: n is number in *each* group
The power is 48% - not even close to the generally adopted standard of 80%. More participants are needed to detect the hypothesized effect. Can you find the n for which power is 80%?
EMA study designs are often characterized by repeated measures, complex multi-level structures and the application of advanced statistical techniques. You may find that available power calculators are too limited to properly take key aspects of your design into account. If this happens, simulation techniques may help. If power is the probability that a test will detect an effect it is exists, it can be determined by noting the proportion of times a statistical test reaches significance, if it is run, many times, on simulated data, in which the hypothesized effect is present. To illustrate how this works, we will calculate the power of the t-test again, through simulation:
# Power analysis of a t-test
# (simulation approach).

m1 = 0   # mean in group 1
m2 = 0.5 # mean in group 2
sd = 1   # sd (in both groups)
n = 30   # sample size, per group

# conduct the experiment many times
nsim <- 10000
p <- numeric(nsim)
for (i in 1:nsim) {

  data <- data.frame(
    outcome <- c(
      rnorm(n, m1, sd), # group 1 data
      rnorm(n, m2, sd)  # group 2 data
    ),
    group <- c(
      rep(1, n), # group 1 indicator
      rep(2, n)) # group 2 indicator
  )

  # save significance of test
  p[i] <- t.test(outcome ~ group, data)$p.value
}

# power
sum(p < 0.05) / nsim
#> [1] 0.4717
As can be seen, the simulation results are very close to the output of pwr.t.test. There was no immediate need to run this simulation. We already knew that the power was 48%. The example illustrates, however, that simulation is a valid option when power calculators are too limited. Simulating the right data, of course, can be challenging as well, but you will find that R has packages that simplify data simulation. For example, mvrnorm in package MASS (Venables & Ripley, 2002) can be used to generate correlated data, and package simstudy (Goldfeld, 2018) can be used to generate complex longitudinal and hierarchical data.
3.6 What are the Ethical Aspects?
All clinical studies that involve human participants need to be evaluated by a Medical Research and Ethics Committee (MREC; Dutch: ‘METC’). Recently, the committees have also been tasked to determine whether a medical device is used and to evaluate the safety and quality of the device. Researchers are therefore required to add a section in the research protocol, explaining why the software/device is or is not a medical device. The official definition of a medical device (Medical Device Act, or ‘Wet Medische Hulpmiddelen’) is as follows:
“Any instrument, apparatus or appliance, any software or material or any other article that is used alone or in combination, including any accessory and the software required for its proper operation, that is intended by the manufacturer to be used specifically for diagnostic or therapeutic purposes, and is intended by the manufacturer to be used for human beings for the purpose of: - diagnosis, prevention, monitoring, treatment or alleviation of disease - diagnosis, monitoring, treatment, alleviation of or compensation for an injury or handicap - investigation, replacement or modification of the anatomy or of a physiological process - control of conception, and which does not achieve its principal intended action in or on the human body by pharmacological, immunological or metabolic means, but which may be assisted in its function by such means.” (CCMO, 2018)
In short, software can be classified as a medical device when it collects patient-specific data and when it is specifically intended for one of the above-mentioned objectives. In practice, the definition of medical devices leaves a lot of room for confusion. Researchers often struggle with the question whether their assessment tools should be considered a medical device or not. For this purpose, flowcharts exist that help to determine whether an app or another software product should be classified as a medical device (see, e.g., Ekker & van Rest, 2013, and http://cetool.nl/general/scanAid). Figure 3.2 shows such a flow-chart.
While planning your EMA study, you should also be mindful of the rules and regulations that apply to data collection, storage and sharing. From May 2018 onward, the European Committee has enforced the General Data Protection Regulation (GDPR; in Dutch: “Algemene Verordening Gegevensbescherming - AVG”“; see https://gdpr-info.eu/), which protects the data and privacy of EU citizens. Complying to the GDPR can be a complex and time-consuming process, depending on nature of your study. Do not hesitate to consult local experts or standard guidelines provided by your organization (see, e.g., http://www.emgo.nl/kc/checklist-avg/).
In EMA studies, an important GDPR-related issue concerns the Data Processing Agreement (DPA). When data processing is (partly) outsourced to a third party, a Data Processing Agreement (DPA) should be drafted, that specifies the agreements between the ‘controller’ and ‘processor’. In this context, a controller is the person or organization that determines the why and how of data collection (for example you as a researcher). The processor processes the data on behalf of the controller, for example by providing a data-collection service, or by storing raw study data on a cloud-server.
Aspects of data processing that need to be addressed in this agreement include the context, duration and termination of agreement, the nature of the data collected, the duration of data storage, security measures taken to prevent unauthorized access, and agreements on data ownership, data sharing, the handling of personal data breaches, and liability. Most organizations offer model agreements in which all relevant issues are addressed. Third parties may offer model agreements as well. If so, however, these agreements need to be checked for compliance to local regulations.
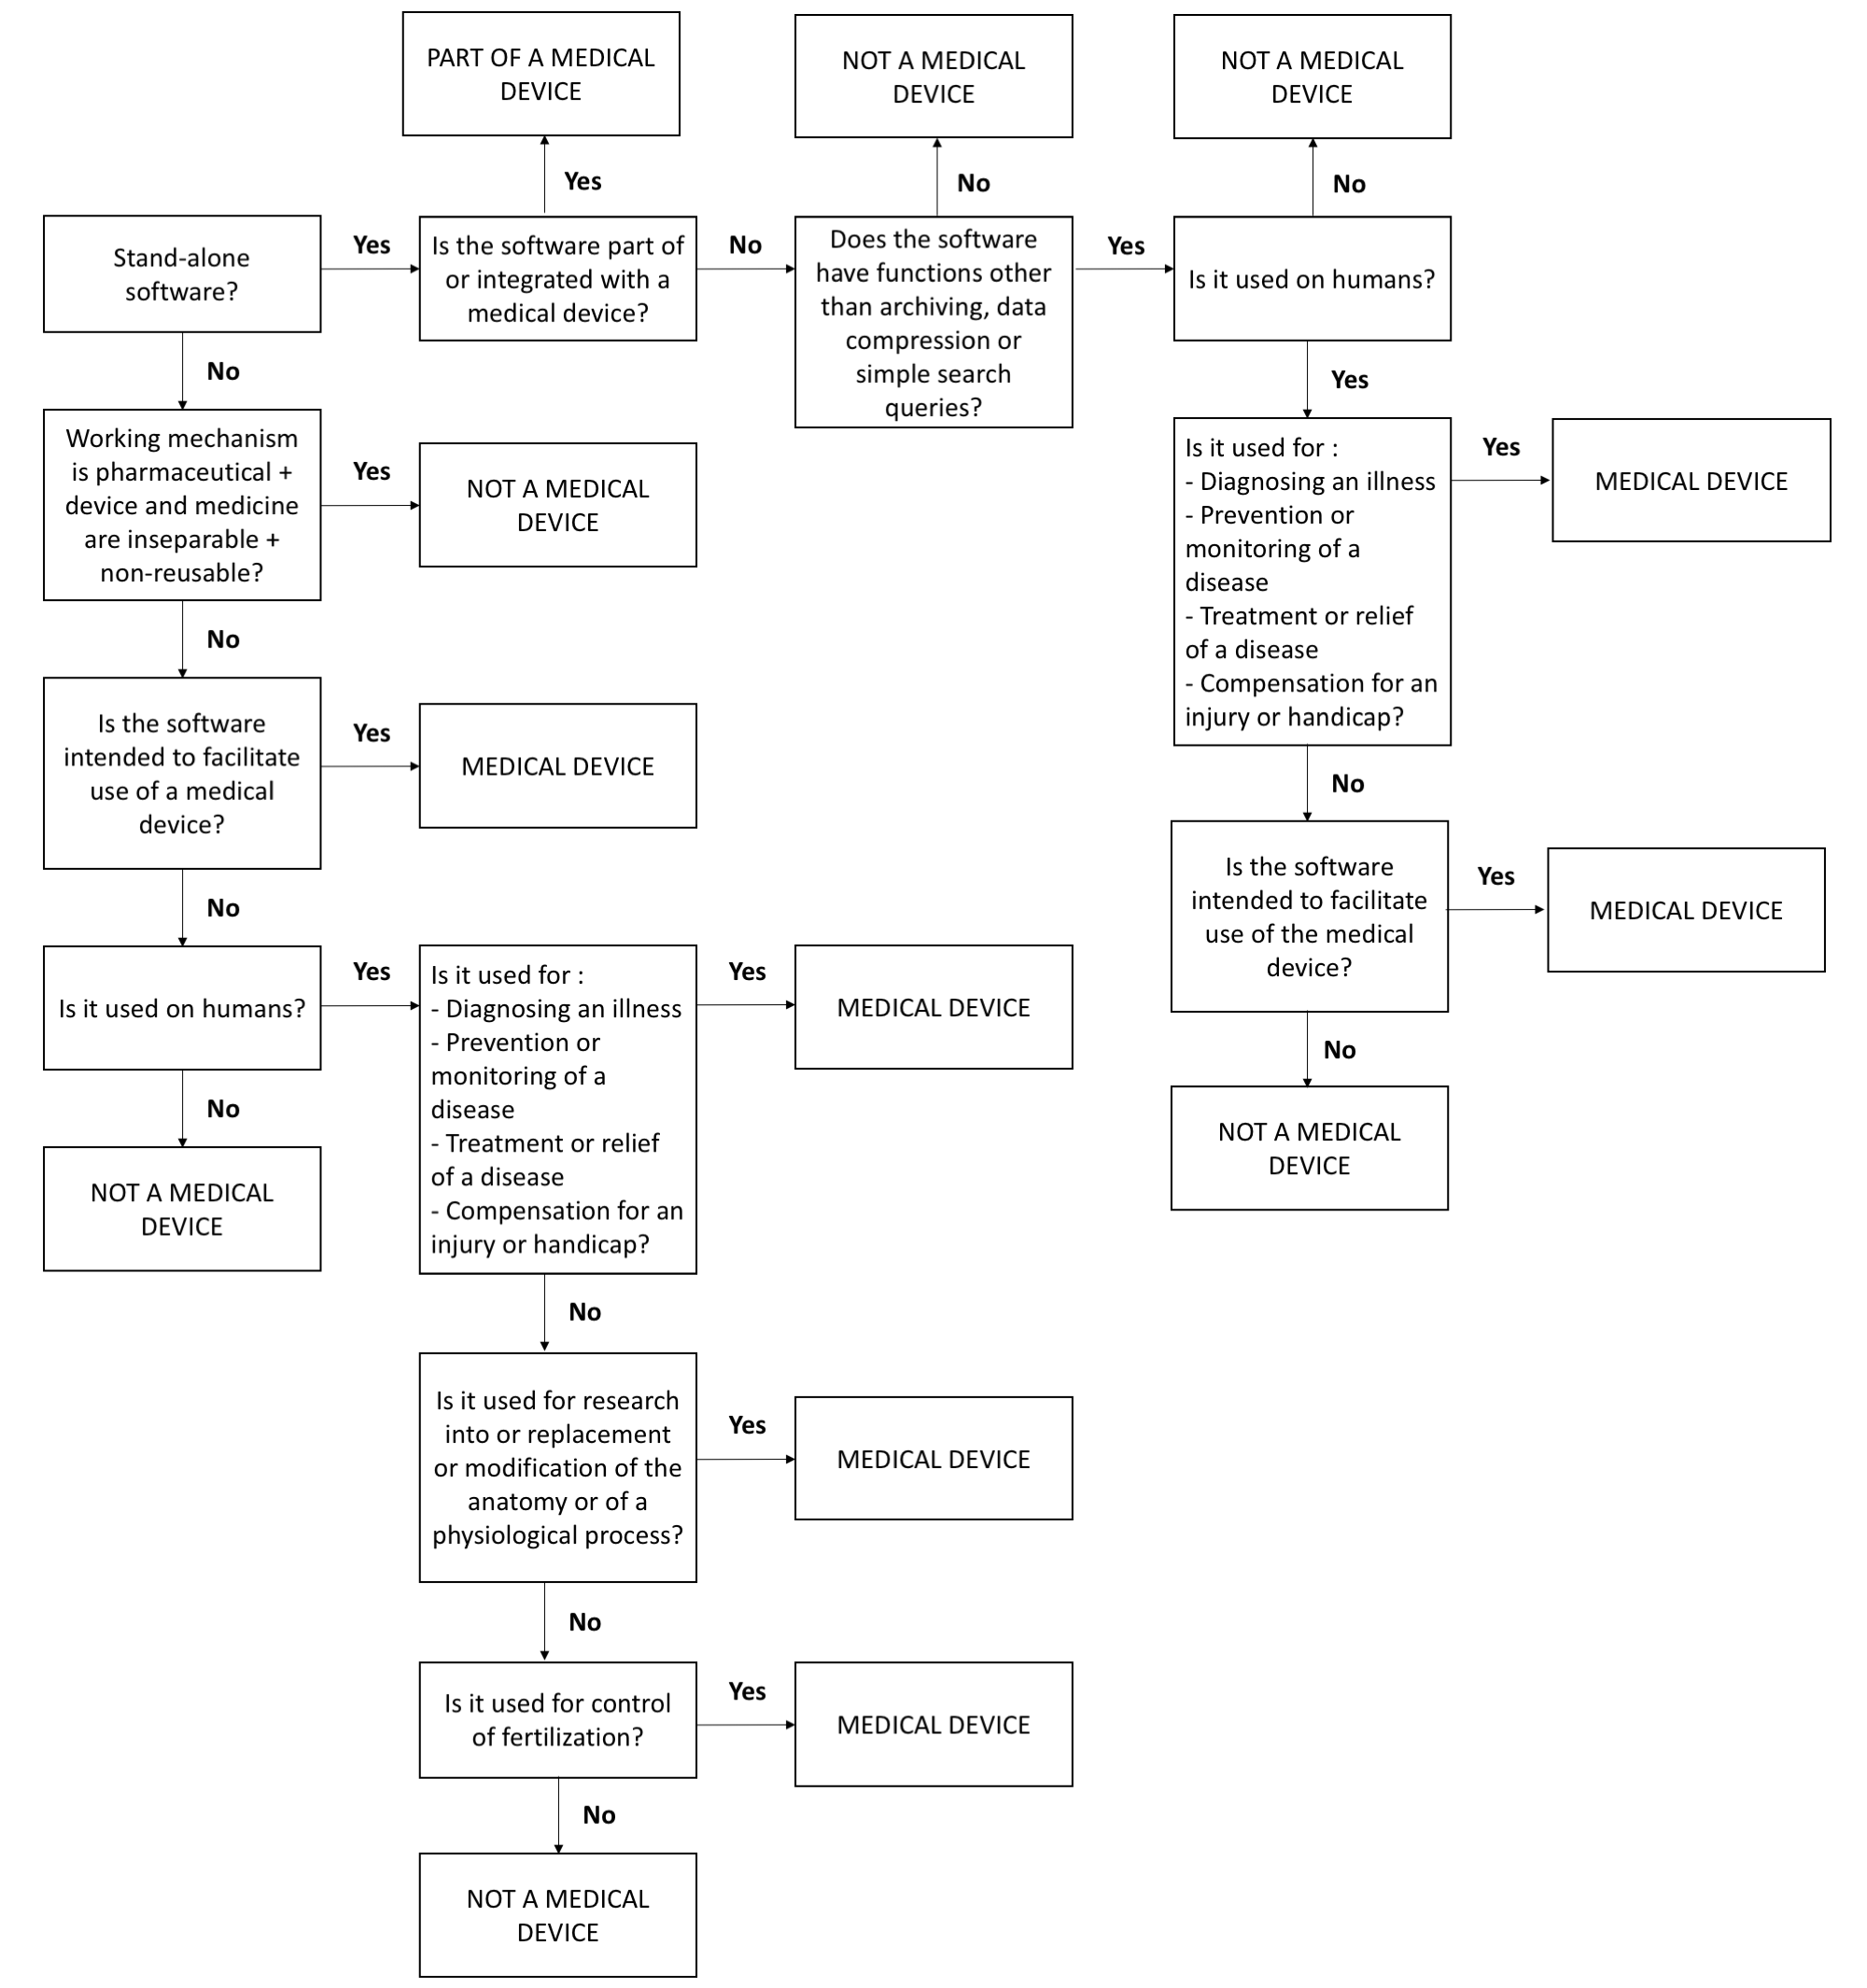
Figure 3.2: Flow-chart to determine whether study devices (including EMA apps) should be considered a medical device. Based on http://cetool.nl/general/scanAid
References
Shiffman, S., Stone, A. A., Hufford, M. R., Rev, A., Psychol, C., Shiffman, S., … Hufford, M. R. (2008). Ecological Momentary Assessment. Annual Review of Clinical Psychology, 4(1), 1–32. https://doi.org/10.1146/annurev.clinpsy.3.022806.091415
Moore, R. C., Depp, C. A., Wetherell, J. L., & Lenze, E. J. (2016). Ecological momentary assessment versus standard assessment instruments for measuring mindfulness, depressed mood, and anxiety among older adults. Journal of Psychiatric Research, 75, 116–123. https://doi.org/10.1016/j.jpsychires.2016.01.011
Van Rijsbergen, G. D., Bockting, C. L. H., Berking, M., Koeter, M. W. J., & Schene, A. H. (2012). Can a one-item mood scale do the trick? Predicting relapse over 5-years in recurrent depression. Plos One, 7(10), 1–5. https://doi.org/10.1371/journal.pone.0046796
Schuurman, N. K., Houtveen, J. H., & Hamaker, E. (2015). Incorporating measurement error in n= 1 psychological autoregressive modeling. Frontiers in Psychology, 6, 1038. https://doi.org/10.3389/fpsyg.2015.01038
Stone, A. A., & Shiffman, S. (2002). Capturing momentary, self-report data: A proposal for reporting guidelines. Annals of Behavioral Medicine, 24(3), 236–243. https://doi.org/10.1207/S15324796ABM2403_09
Evenson, K. R., Goto, M. M., & Furberg, R. D. (2015). Systematic review of the validity and reliability of consumer-wearable activity trackers. International Journal of Behavioral Nutrition and Physical Activity, 12(1), 159. https://doi.org/10.1186/s12966-015-0314-1
Piasecki, T. M., Hufford, M. R., Solhan, M., & Trull, T. J. (2007). Assessing clients in their natural environments with electronic diaries: Rationale, benefits, limitations, and barriers. Psychological Assessment, 19(1), 25–43. https://doi.org/10.1037/1040-3590.19.1.25
Hufford, M. R., Shields, A. L., Shiffman, S., Paty, J., & Balabanis, M. (2002). Reactivity to ecological momentary assessment: An example using undergraduate problem drinkers. Psychology of Addictive Behaviors, 16(3), 205–211. https://doi.org/10.1037//0893-164X.16.3.205
Van Ballegooijen, W., Ruwaard, J., Karyotaki, E., Ebert, D. D., Smit, J. H., & Riper, H. (2016). Reactivity to smartphone-based ecological momentary assessment of depressive symptoms (MoodMonitor): Protocol of a randomised controlled trial. BMC Psychiatry, 16(1), 359. https://doi.org/10.1186/s12888-016-1065-5
Venables, W. N., & Ripley, B. D. (2002). Modern applied statistics with S (Fourth). New York: Springer. Retrieved from http://www.stats.ox.ac.uk/pub/MASS4
Goldfeld, K. (2018). Simstudy: Simulation of study data. Retrieved from https://CRAN.R-project.org/package=simstudy
CCMO. (2018). Research with a medical device. Retrieved from http://www.ccmo.nl/en/research-with-a-medical-device
Ekker, A., & van Rest, B. (2013). Medische apps, is certificeren nodig? In 7 stappen naar een CE-markering voor uw app. Den Haag: Nictiz. Retrieved from https://www.nictiz.nl/wp-content/uploads/2013/05/13005-Whitepaper-medische-apps.pdf